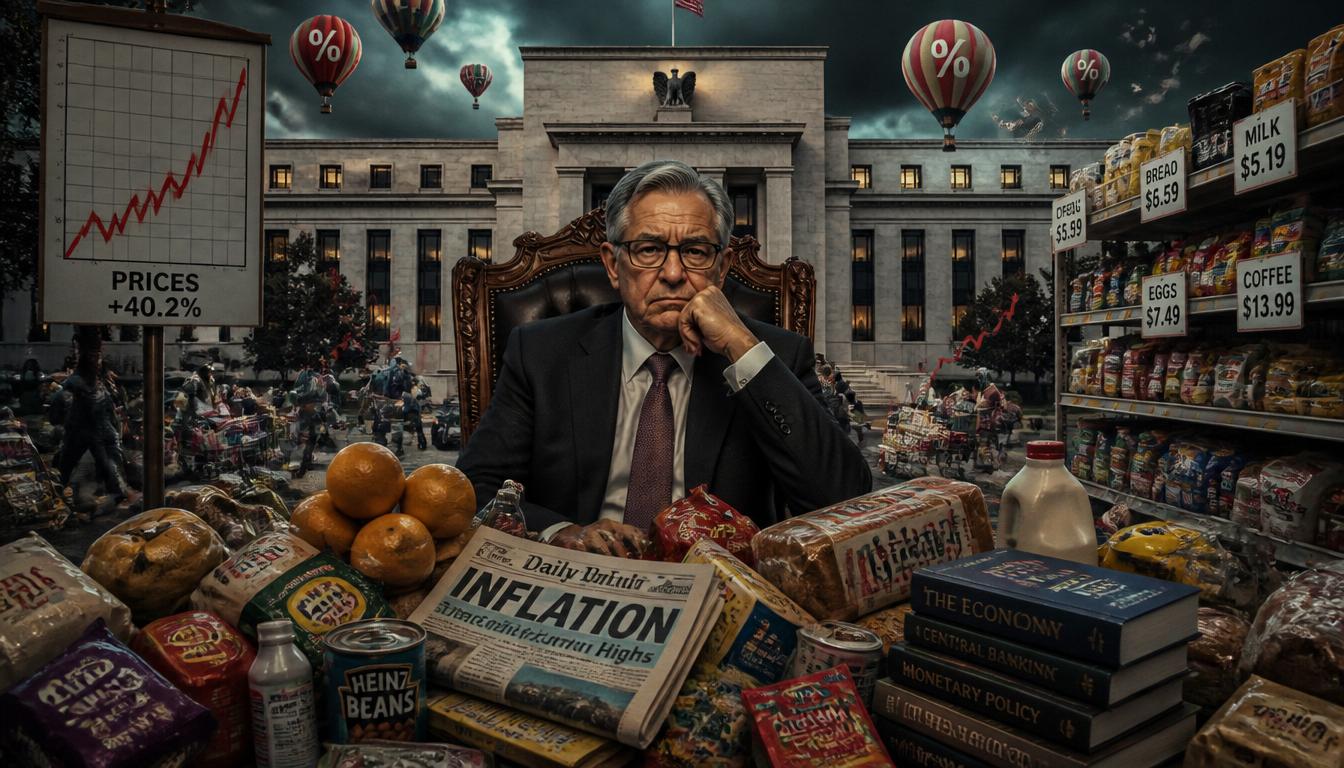
They tell a tidy story: they acted decisively in 2022, and inflation came back under control. It is a convenient story if you are a central banker. Seven charts — and a great deal of data — tell a very different one.
Central banks like to claim that they can beat inflation. The claim does not survive contact with the evidence.
A consistent story has been told across the developed world. Central banks, we are assured, acted decisively in 2022 by raising interest rates, and as a direct consequence inflation is now back under control. The technocrats stepped in, turned the dial, and steadied the ship.
It is a flattering account. It is also, in large part, untrue. Look at seven major economies — the UK, the United States, the Eurozone, Canada, Australia, New Zealand, and Sweden — and what emerges is not a story of triumph. It is a demonstration of the limits of central banking, and a serious challenge to the entire theory on which modern monetary policy rests. For the parallel UK fiscal story, see why the national debt is really the nation's savings and how the City profits from high UK borrowing costs.
The argument is straightforward. Inflation in 2021–22 was driven by supply shocks, not excess demand. It was already falling before most rate rises were complete. The "independent" central banks all reacted in almost exactly the same way. High rates may now be feeding the very inflation they were meant to cure. And the costs have fallen hardest on working people and debtors.
01 / The SurgeA shock that came from the supply side
Every one of the seven economies saw inflation surge through 2021 and 2022. The causes are well known: pandemic shutdowns that fractured global supply chains, and then a violent commodity shock after Russia's invasion of Ukraine in February 2022. Container ships sat idle. Energy markets convulsed. Grain corridors closed.
None of this was a story about an overheating economy with too much money chasing too few goods. It was a story about the goods themselves becoming scarce and expensive. We can date the pressure precisely.
Brent crude touched an intraday high of roughly $139 a barrel on 7 March 2022, its highest since 2008. European wholesale gas (the Dutch TTF benchmark) spiked to an all-time record of around €342/MWh in August 2022 — roughly fifteen times its pre-crisis level — before collapsing back below €40 within a year. And the UN FAO Food Price Index hit a record 159.3 points in March 2022, up 12.6% in a single month, as the war choked off exports from two countries that together supplied about 30% of the world's wheat.
None of these prices rose because households suddenly demanded more. They rose because supply was throttled.
02 / The ResponseLate, timid, and strikingly synchronised
Faced with this, the central banks tightened — and they tightened hard, raising base rates aggressively before, eventually, cutting them again. The moves were not precisely synchronised, but they were remarkably similar in shape and timing.
| Economy | Measure | Peak inflation | Month of peak |
|---|---|---|---|
| United Kingdom | CPI | 11.1% | Oct 2022 |
| Eurozone | HICP | 10.6% | Oct 2022 |
| United States | CPI | 9.1% | Jun 2022 |
| Canada | CPI | 8.1% | Jun 2022 |
| Australia | CPI | 7.8% | Dec 2022 qtr |
| New Zealand | CPI | 7.3% | Jun 2022 qtr |
| Sweden | CPIF | 10.2% | Dec 2022 |
| Central bank | First hike | Starting point | Peak rate | Rate now (mid-2026) |
|---|---|---|---|---|
| RBNZ (New Zealand) | Oct 2021 | 0.25% | 5.50% | 2.25% |
| Bank of England | Dec 2021 | 0.10% | 5.25% | 3.75% |
| Federal Reserve | Mar 2022 | 0–0.25% | 5.25–5.50% | 3.50–3.75% |
| Bank of Canada | Mar 2022 | 0.25% | 5.00% | 2.25% |
| RBA (Australia) | May 2022 | 0.10% | 4.35% | 3.60% |
| ECB (deposit rate) | Jul 2022 | −0.50% | 4.00% | 2.00% |
| Riksbank (Sweden) | 2022 | 0.00% | 4.00% | 1.75% |
The European Central Bank was dangerously late. It kept its deposit rate negative — at −0.5%, where it had sat since 2014 — while Eurozone inflation climbed past 8% and headed for double digits. It did not begin raising rates until July 2022. The delay meant deeply negative real interest rates across the bloc: borrowing was, in real terms, effectively subsidised.
The Federal Reserve moved a little earlier, in March 2022 — but only after US inflation had already reached 7.9%. The Bank of England was earlier still, in December 2021. Yet its first move was an increase of just 0.15 percentage points, from 0.1% to 0.25%.
Only New Zealand came close to acting in a timely way — and even there, inflation still ran beyond 7%. The RBA had told the public in 2021 that rates were unlikely to rise before 2024; it then had to abruptly reverse and start hiking in May 2022. Canada followed the same shape: slow to act, then aggressive.
So much, then, for central bank independence. These banks did not look independent of one another. They may have been free of their governments, but they shared a single combined mindset — and that, in itself, suggests the claim of independence is fundamentally flawed.
03 / The FallInflation dropped before the medicine could work
Here is the part of the story that should give the technocrats most pause. In every single case, inflation fell back — and in many cases it began falling before most of the rate rises were even complete.
The clearest example is the United States. CPI peaked at 9.1% in June 2022 and was already descending while the Fed carried on hiking all the way to its July 2023 peak. The disinflation was well under way before the tightening cycle had finished. Why? Because the original supply shocks were easing of their own accord.
How much of the surge was genuinely supply-driven? The San Francisco Fed's own decomposition of US inflation concluded that, in mid-2022, supply-side factors explained a little more than half of the excess — and that is the central bank's own research, not an outside critic's.
But here is the sting in the tail. In many of these economies, inflation has not returned cleanly to its 2% target. It has settled above it — while interest rates remain far above pre-2022 norms. The UK is the textbook case.
04 / The ParadoxWhat if high rates are now feeding inflation?
This brings us to the most provocative claim, and the one that should most unsettle orthodox monetary thinking. High interest rates may themselves be a source of inflationary pressure.
The logic is not exotic. Raising interest rates is, quite literally, raising the price of money. Higher mortgage costs, higher business borrowing costs, and higher government debt-servicing costs all feed through into the prices of goods, services and rents.
Canada — CPI
Mortgage interest is included in the index
Rate hikes → CPI rises
(mortgage cost +~30% at peak)
UK — CPI
Mortgage interest is excluded from CPI
Same hike, hidden cost
(shows up in RPI instead)
This was, in effect, the wrong cure for the wrong illness. Higher interest rates cannot unload a backed-up container ship. They cannot pump more gas into Europe. They cannot reopen a Ukrainian grain corridor. Yet that was the implicit theory behind the 2022 tightening.
05 / The BillWho actually paid for all this
Higher interest rates benefit savers, banks, and holders of financial wealth. They penalise mortgage borrowers, indebted businesses, and governments trying to fund public services. The transfer of income from labour to capital — from those who owe to those who own — becomes more explicit with every rate rise. That is not a glitch in the mechanism. It is how the mechanism works. For the UK-specific architecture of that transfer, see The City Is Holding Britain Hostage and Why the City Will Never Fund Small Business.
| Who gains | Who pays |
|---|---|
| Savers & depositors | Mortgage holders (esp. variable / re-fixing) |
| Banks (wider net margins) | Indebted businesses & new investors |
| Bondholders & financial-wealth owners | Governments servicing public debt |
| Holders of existing capital | Renters (via landlords' rising costs) |
The Bank of England estimated that around four million UK households would be exposed to higher rates over the course of 2023 as fixed deals expired. UK government debt-interest payments hit £19.4 billion in a single month (June 2022) — more than double a year earlier.
06 / The Live Test2026 is proving the point in real time
A fresh and severe energy shock has hit the global economy. Conflict in the Gulf disrupted shipping through the Strait of Hormuz — the chokepoint for roughly a fifth of the world's oil — and Brent crude surged back above $120 a barrel before easing on hopes of a ceasefire. Oil has since dropped about 20% from its 2026 peak, settling in the low-$90s.
Inflation is being pushed up again — by a pure supply shock, with no excess demand anywhere in sight. Rates across the board are stuck on hold, and some officials are now openly contemplating hikes. The Bank of England has warned that higher inflation is, in its word, "unavoidable." This is the kind of regime where staying on the right side of the move matters most; traders running forex, indices and commodities on MT5 are increasingly leaning on tools like the manual pattern stealth strategy to navigate the whipsaw.
07 / The ReckoningHas the whole model failed?
Step back and the picture is sobering. Inflation surged. Central banks reacted too late. Enormous social costs were imposed. And the gains were, at best, hard to identify — because inflation eased largely as the supply shocks faded of their own accord, not because monetary policy engineered a cure.
Worse, having pushed rates sharply higher, the banks have not found the courage to cut them sufficiently again. Many economies now appear stuck in a new and uncomfortable equilibrium: structurally higher interest rates than they need, paired with a persistent residual inflation problem. The cure has become a chronic condition.
The cult of the independent central bank has nonetheless survived. It is treated as though it is always and forever correct, and to challenge it is regarded as something close to economic heresy. But the evidence shows that we have suffered as a consequence of these policies.
They were indecisive. They were late. They were ineffective on their own terms. And they may now be causing the very harm they claim to prevent. So it is time to ask the essential question plainly: should the era of independent central banks now be over — and was it ever truly fit for purpose?
My own answer is yes, it is time for them to go. But the more important answer is yours. What do you think?
A note on sources & figures
Inflation peaks and dates are drawn from ONS (UK), the Bureau of Labor Statistics (US), Eurostat (Eurozone), Statistics Canada, the Australian Bureau of Statistics, Stats NZ, and Statistics Sweden. Policy-rate timelines come from the respective central banks. Supply-shock evidence draws on the NY Fed's Global Supply Chain Pressure Index, the San Francisco Fed's supply/demand decomposition of inflation, the UN FAO Food Price Index, and market data for Brent crude and European gas.
For the macro-to-markets bridge, see our pages on forex, indices, commodities and stocks. To translate macro into a repeatable process, start with developing a trading strategy and how to backtest in MT5. Ongoing macro is tracked on trending topics.
From The Blog
Explore more long-reads on markets, money & policy →
Deep dives on monetary policy, the bond markets, prop firms and the tools serious traders use on MT5.